Organic search reporting is broken.
Not because the data is wrong but because the questions have changed.
Old visibility meant:
- Ranking #1
- Owning impressions
- Growing sessions
New visibility means:
- Being referenced by AI answers
- Avoiding CTR suppression
- Maintaining influence even when traffic declines
Most dashboards still report pre-AI SEO metrics. Executives see "stable rankings" while revenue quietly erodes.
This article explains how to build an AI-Search Visibility Dashboard using:
- Google Analytics 4
- Google Search Console
- BigQuery
- Google Looker Studio
The goal is not more charts. The goal is executive ready AI impact monitoring.
Why Traditional SEO Dashboards No Longer Work
Classic dashboards assume this flow:
Rankings → CTR → Traffic → Conversions
AI search breaks the chain between rankings and clicks.
You now see patterns like:
- Rankings stable
- Impressions stable
- CTR declining
- Traffic declining
- Revenue declining
The missing variable? AI answers intercepting demand.
If your dashboard doesn't explicitly measure AI impact, leadership is flying blind.
What an AI-Search Visibility Dashboard Must Answer
An executive does not care about:
- Average position
- Keyword count
- Indexed pages
They care about:
- Where are we losing visibility to AI answers?
- Which queries are becoming zero-click by design?
- Which content still influences AI outputs?
- What is the revenue risk trajectory?
Your dashboard must translate AI behavior into business language.
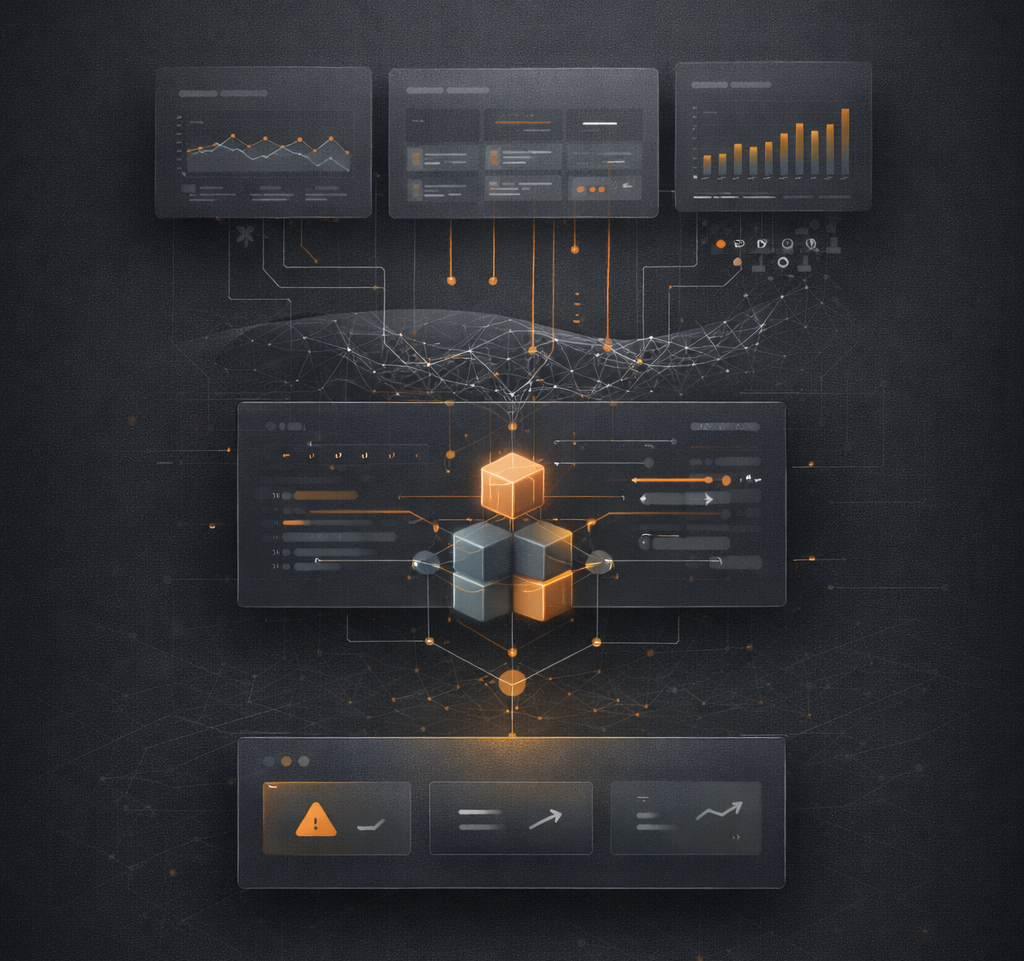
The Core Architecture
At a high level, the pipeline looks like this:
- GSC → Query-level search behavior
- GA4 → On-site outcomes and value
- BigQuery → Data modeling & joins
- Looker Studio → Executive visualization
Each tool does what it's best at.
Step 1: Query Class Segmentation (The Foundation)
Not all queries are equally affected by AI.
Before building metrics, you must classify queries.
Common query classes:
- Informational ("what is", "how does")
- Commercial research ("best", "compare")
- Transactional ("buy", "pricing")
- Navigational (brand terms)
- Local / GEO
AI answers disproportionately suppress informational and research queries.
If you don't segment queries, AI impact gets averaged away.
Query Classification Logic (Conceptual)
In BigQuery, classify queries using pattern matching:
CASE
  WHEN query LIKE '%what%' OR query LIKE '%how%' THEN 'informational'
  WHEN query LIKE '%best%' OR query LIKE '%vs%' THEN 'commercial'
  WHEN query LIKE '%price%' OR query LIKE '%buy%' THEN 'transactional'
  ELSE 'other'
END AS query_class
This is not perfect—but it's directionally powerful.
Step 2: Detecting AI-Answer Overlap
The most important new metric is AI-answer overlap.
AI-answer overlap asks: "Is this query likely being answered directly by an AI overview?"
Signals include:
- Sudden CTR drop without ranking change
- Stable impressions with falling clicks
- SERP features expanding above organic results
You may not have explicit AI flags but behavior tells the story.
AI-Answer Overlap Heuristic
In BigQuery:
CASE
  WHEN ctr_after < ctr_before
   AND ABS(avg_position_after - avg_position_before) < 0.5
  THEN 1
  ELSE 0
END AS ai_overlap_flag
This flags queries where AI interception is likely.
Step 3: Pre/Post CTR Suppression Modeling
Now quantify loss.
SELECT
  query,
  query_class,
  AVG(ctr_before) - AVG(ctr_after) AS ctr_loss
FROM search_console_data
GROUP BY query, query_class;
This turns AI impact into:
- Measurable deltas
- Comparable across query classes
- Trackable over time
Executives understand loss.
Step 4: GA4 Event Stitching (Turning Loss Into Value)
CTR loss alone is not a business metric.
You must connect:
Query → Landing page → Session → Conversion → Revenue
This is where GA4 comes in.
GA4 Event Stitching Concept:
In BigQuery:
- Join GSC query → landing page
- Join landing page → GA4 sessions
- Attach conversion value or proxy
Now you can answer: "What is the estimated revenue impact of AI-driven visibility loss?"
That is CFO-level insight.
Step 5: Defining AI-Search Visibility Metrics
Your dashboard should focus on four core metrics.
1. AI Visibility Index
A composite score based on:
- Query volume
- CTR retention
- AI overlap probability
This shows overall exposure health, not traffic.
2. AI Suppression Rate
Percentage of queries experiencing CTR suppression without ranking loss.
This isolates AI effects from SEO issues.
3. Influence vs Traffic Ratio
Measures:
- Pages still cited or influencing AI answers
- Even when traffic declines
This reframes SEO success away from clicks alone.
4. Revenue at Risk
Estimated revenue tied to:
- AI-suppressed queries
- Informational demand loss
- Early funnel interception
This metric gets budgets approved.
Step 6: BigQuery as the Intelligence Layer
BigQuery is not optional at this stage.
You need it to:
- Handle time-series analysis
- Run cohort comparisons
- Normalize data sources
- Create repeatable pipelines
Without BigQuery, AI impact analysis collapses into spreadsheets.
Example: Weekly AI Impact Snapshot
SELECT
  DATE_TRUNC(date, WEEK) AS week,
  SUM(impressions) AS impressions,
  SUM(clicks) AS clicks,
  AVG(ctr) AS avg_ctr,
  SUM(ai_overlap_flag) AS ai_impacted_queries
FROM ai_search_visibility_table
GROUP BY week;
This produces trend ready data.
Step 7: Looker Studio — Executive Ready Visualization
Looker is where complexity must disappear.
Executives should see:
- Fewer charts
- Clear narratives
- Directional signals
Recommended Dashboard Sections:
1. AI Visibility Overview
- AI Visibility Index
- Trend arrows
- Risk status (stable / declining)
2. Query Class Impact
- Informational vs transactional CTR loss
- Visual comparison
3. Revenue Risk
- Estimated monthly impact
- Top affected content areas
4. Early Warning Signals
- Queries entering AI-overlap zone
- Pages approaching suppression thresholds
No keyword tables. No vanity charts.
Step 8: Looker Calculated Fields
Looker lets you abstract complexity using calculated fields.
Example:
- AI_Suppression_Score
- Visibility_Risk_Level
- AI_Impact_Trend
These allow leadership to:
- Consume insights without raw data exposure
- Track change over time
- Make decisions quickly
Why This Dashboard Changes SEO's Role Internally
SEO stops being:
"Traffic optimization"
And becomes:
"AI-era demand visibility management"
This elevates SEO into:
- Strategic planning
- Forecasting
- Risk mitigation
Teams that adopt this dashboard:
- Stop reacting late
- Detect AI shifts early
- Protect revenue proactively
Common Mistakes to Avoid
- Reporting rankings without CTR context
- Aggregating all queries together
- Ignoring informational queries
- Treating AI impact as "unmeasurable"
- Waiting for official AI metrics
AI doesn't wait. Neither should your reporting.
The Strategic Shift: From SEO Dashboards to AI Visibility Systems
Old dashboards answer:
"How did SEO perform last month?"
AI visibility dashboards answer:
"Where will search driven revenue break next quarter?"
That is a fundamentally different role.
And it's the role SEO teams must step into.
Key Takeaways
- Traditional SEO dashboards fail to measure AI-driven CTR suppression
- Query class segmentation reveals disproportionate AI impact on informational queries
- BigQuery enables time-series analysis and GA4/GSC joins for revenue impact modeling
- Four core metrics: AI Visibility Index, AI Suppression Rate, Influence vs Traffic, Revenue at Risk
- Looker Studio calculated fields abstract complexity for executive consumption
- Dashboard transforms SEO from traffic optimization to AI-era visibility management
Final Thoughts: If You Can't See AI Impact, You Can't Manage It
AI search is not killing organic search.
It's changing how visibility works.
The teams that win are not those who:
- Chase rankings harder
- Publish more content
- Argue about attribution
They are the teams who:
- Measure AI interception
- Quantify visibility loss
- Communicate impact in business terms
- Act before traffic collapses
An AI-Search Visibility Dashboard is not a "nice to have". It is the control panel for modern search strategy.
If your dashboard can't explain AI's impact on your business, it's already outdated.